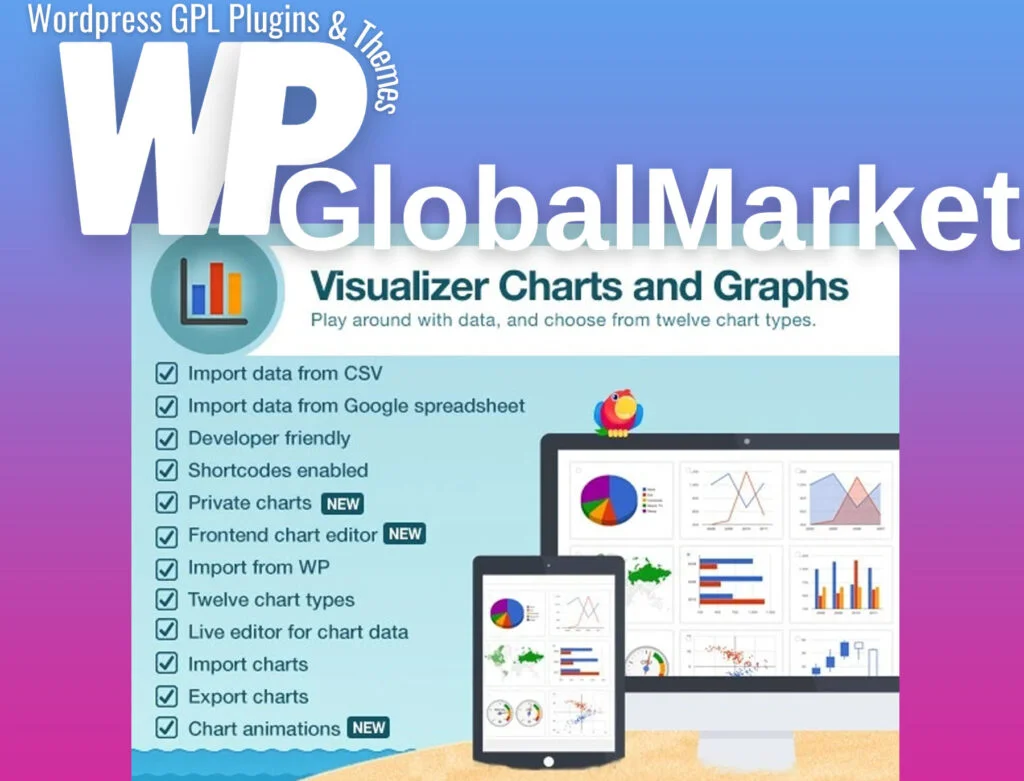
Themeisle visualizer charts and graphs pro

ThemeIsle Visualizer Charts and Graphs Pro

Version: 1.9.5

Last Update: October 29, 2021

100% Original - All Premium Features Included.

We Buy and Download from Original Developers to ensure the most authentic and relevant version. Note: We are not directly affiliated or associated with the developers of this Plugin or Theme and we appreciate the efforts and original work of the authors. Names, phrases and trademarks are used to the minimum extent necessary to accurately and correctly describe the item.

Safe and Secure

Files are scanned for viruses regardless of whether they are original. All files are shared with you when they are safe.

Updates Included (6 Months) - from WPGlobalMarket

We ensure that your site is always up to date, you will be notified as soon as a new version is released on WPGlobalMarket and you will always be up to date

Why So Cheap?

WordPress applies the GPL/GNU license to ALL plugins and themes created for WordPress by 3rd party developers. The GPL license means that every script written for WordPress and its derivatives must be free (including all plugins and Themes). Because we buy all items directly from the authors and redistribute them to the public, we are able to offer incredibly low prices for official items. The price is a one-time price for full access, not a recurring payment. Original Author Support is not included when purchased from WPGlobalMarket. You only get the File.

ThemeIsle Visualizer Charts and Graphs Pro

The ThemeIsle Visualizer Charts and Graphs Pro is a robust tool for creating and displaying tables and charts in a customizable and responsive manner. Here are some key features and chart types available:

Key Features:

  1. Data Sources: Allows manual data input, remote URL data retrieval, database querying, and integration with external APIs for data sourcing.
  2. Customization Options: Offers extensive customization possibilities with 15 chart types, each equipped with dedicated settings for a tailored presentation.
  3. Flexible Display: Embeds charts and tables within posts, pages, or any preferred page builder for versatile display options.

Chart Types Available:

  1. DataTables Table: Presents tabular data in an organized format.
  2. Google Charts (12 Types):
    • Line Chart: Displays data points connected by line segments.
    • Area Chart: Represents quantitative data with shaded areas.
    • Pie Chart: Illustrates numerical proportions with slices.
    • Column Chart: Visualizes comparisons among categories.
    • Gauge Chart: Builds simple gauges with dials.
    • And more…
  3. Charts.js (6 Types):
    • Line Chart
    • Area Chart
    • Pie Chart
    • Table Chart
    • Column Chart
    • Gauge Chart

Each chart type offers a unique way to visualize and present data, ranging from simple comparisons to visual representations of proportions and trends. With the ability to customize these charts extensively, Visualizer provides a comprehensive solution for displaying data effectively on WordPress sites.

Shopping Cart
  • Your cart is empty.